When doing quantitative financial analysis, the first step is to obtain the related data.
In the world of R, multiple packages are capable of doing this. In this post, we briefly
introduce two packages, quantmod and tushare.
The quantmod package is designed to assist the quantitative trader.
The information at its official website is somewhat outdated with the news section being staged at 2009. But this package is still under development at Github.
Fetch the data
We can fetch the data of Huatai 300 ETF with
library(quantmod)
## Loading required package: xts
## Loading required package: zoo
##
## Attaching package: 'zoo'
## The following objects are masked from 'package:base':
##
##     as.Date, as.Date.numeric
## Loading required package: TTR
## Registered S3 method overwritten by 'quantmod':
##   method            from
##   as.zoo.data.frame zoo
getSymbols("510300.SS", src = "yahoo") # Get the data: 300ETF of Huatai
## 'getSymbols' currently uses auto.assign=TRUE by default, but will
## use auto.assign=FALSE in 0.5-0. You will still be able to use
## 'loadSymbols' to automatically load data. getOption("getSymbols.env")
## and getOption("getSymbols.auto.assign") will still be checked for
## alternate defaults.
##
## This message is shown once per session and may be disabled by setting
## options("getSymbols.warning4.0"=FALSE). See ?getSymbols for details.
## [1] "510300.SS"
etf300 <- `510300.SS`    # rename the variable, note the ` sign around the name
rm(`510300.SS`)
In the previous script, the data is fetched from source Yahoo Finance and "510300.SS" is the code name for Huatai 300ETF at yahoo’s website.
This function also supports different data source such as "google" for Google Finance, "FRED" for Federal Reserve Economic Data and "oanda" for Oanda.com. Also "csv" and "rda" for loading data from local source.
By default, getSymbols will return the results in the name of the symbol, in this case, it’s "510300.SS", which is an unusual R variable name since it starts with a number 5. So we rename it to etf300.
Another way is to use setSymbolLookup to tell quantmod how we want our data to be fetched
setSymbolLookup(ETF300 = list(name = "510300.SS",    # now ETF300 is `510300.SS`
                              src = "yahoo"))
and we can check the settings for this symbol with
getSymbolLookup("ETF300") # we can check our setting for this symbol
## $ETF300
## $ETF300$name
## [1] "510300.SS"
##
## $ETF300$src
## [1] "yahoo"
Then we can fetch the data as usual:
getSymbols("ETF300")
## [1] "ETF300"
Save and load the data from local file
One can save the symbol data to local file for easy future access and analysis. This can be done with saveSymbols
saveSymbols("ETF300", file.path = ".")
This command will save the Huatai 300ETF data to a local file called "ETF300.RData" to the current working directory(file.path = ".").
Then one can load it via getSymbols by setting src = "RData":
getSymbols("ETF300", src = "RData",    # we can load data from local file by src = "RData"
           dir = "./",                 # directory and file extension of local file
           extension = "RData")        # see documentation of getSymbols.rda()
## [1] "ETF300"
By default, this function will look for a file with extension .rda. We manually set it with extension = "RData".
Visualize the data
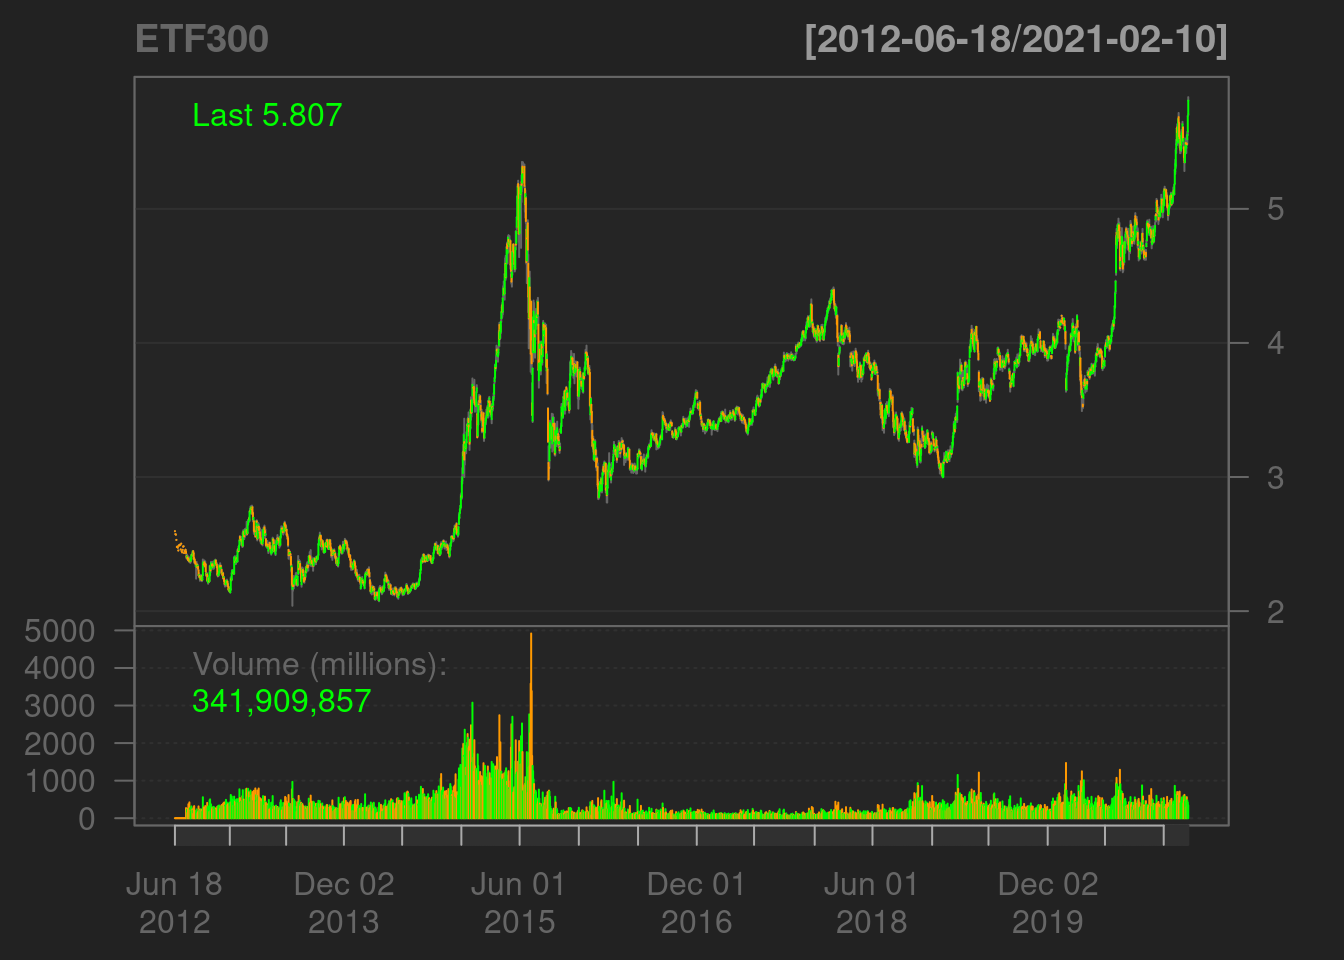
One advantage of quantmod is that it is very easy to visualize the data.
chartSeries(ETF300)
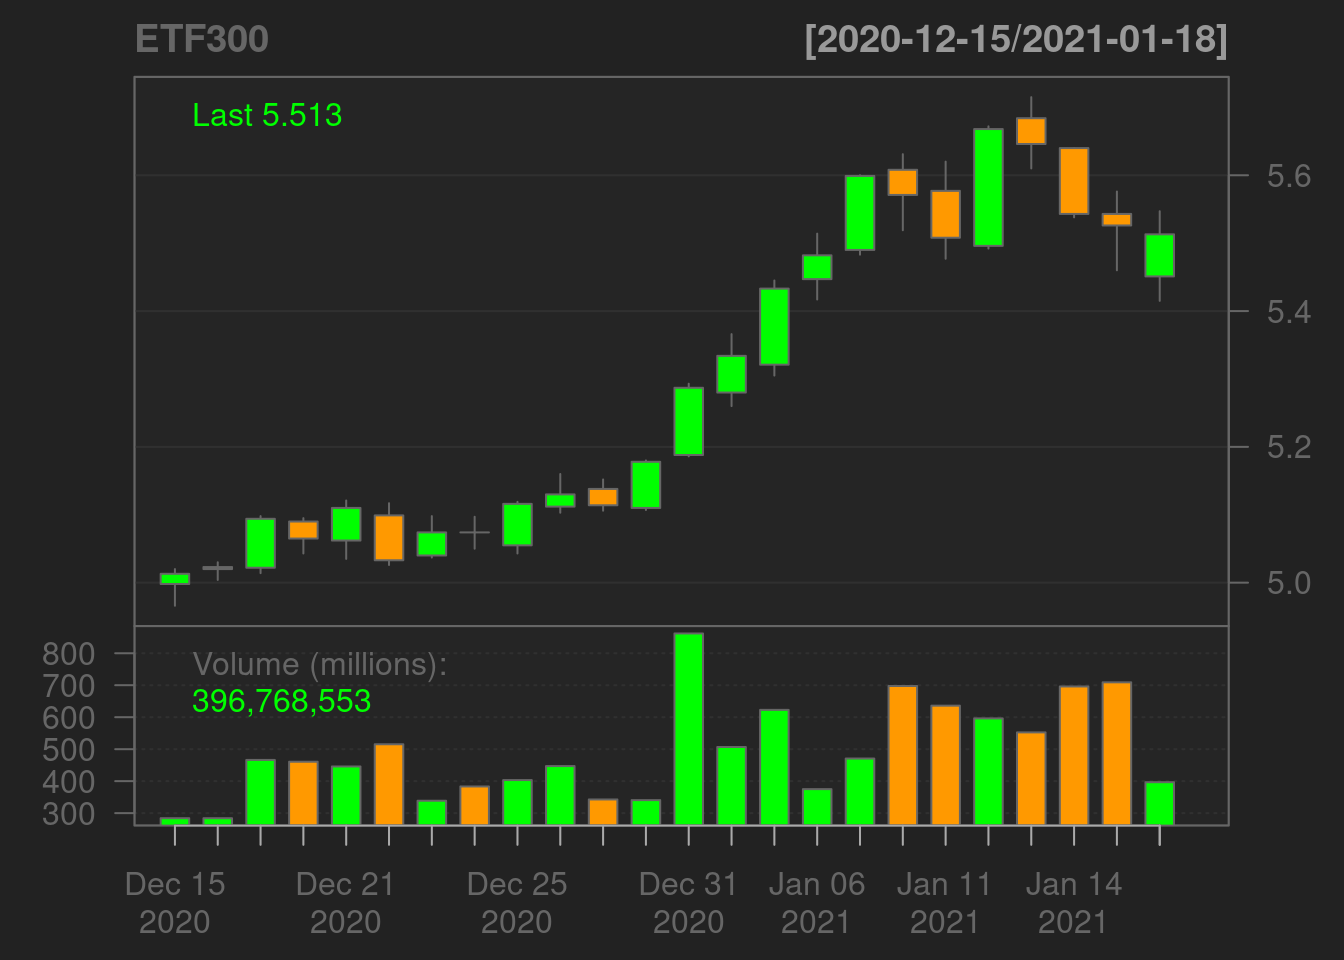
Thanks to xts package, it is easy to visualize a subset of the data
chartSeries(ETF300, subset = "2020-12-15::2021-01-18") # adjust timeline
One can also add technical indicators from the TTR package to existing figures with
addMACD() # add moving average plot
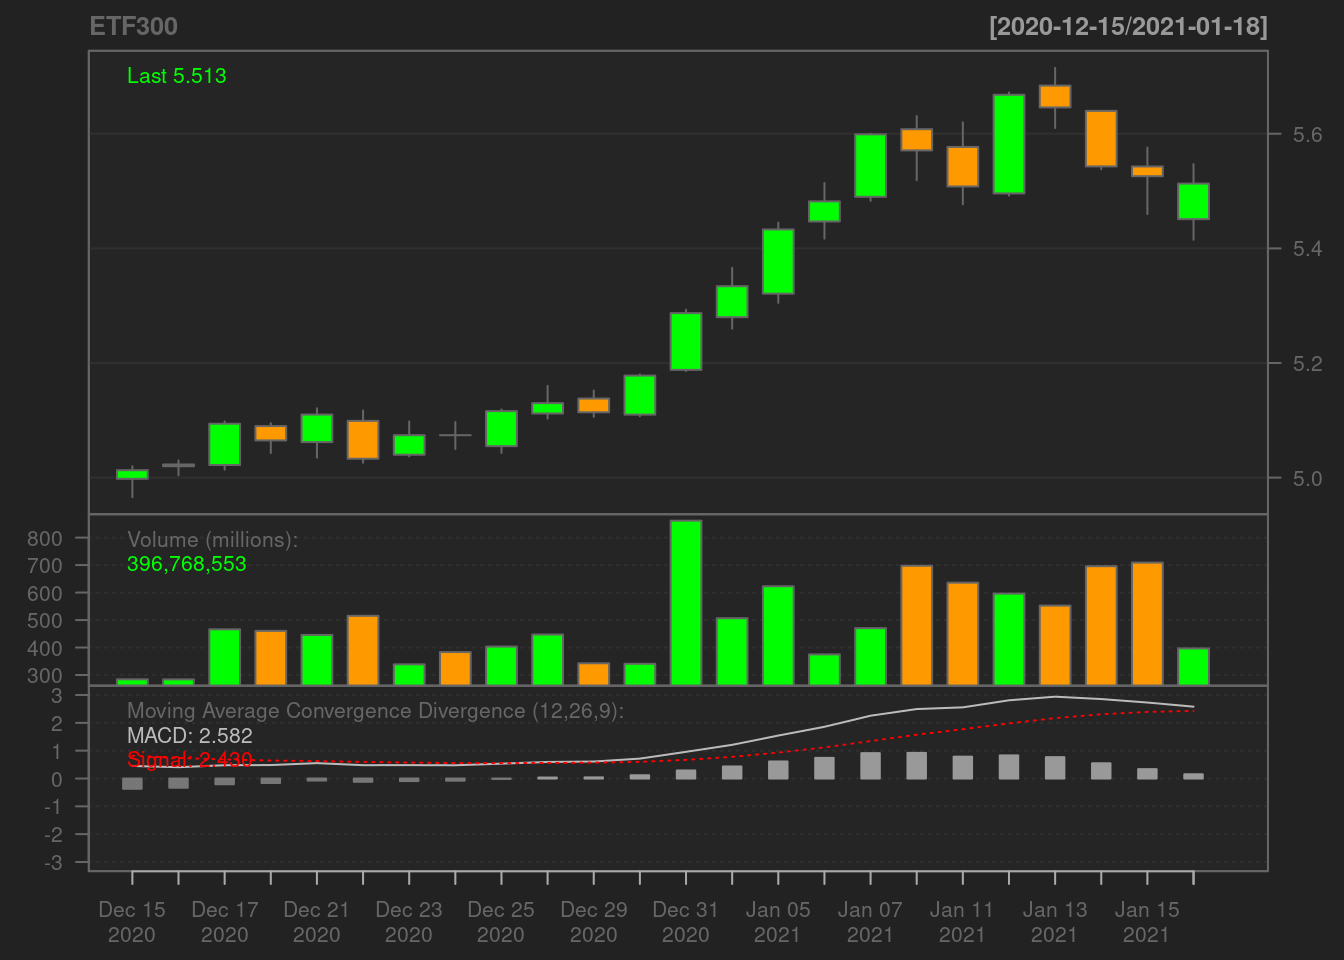
More examples can be found at quantmod’s example website.
In China mainland, it’s somewhat inconvenient to use quantmod due to connection issues with Yahoo Finance and Google Finance.
On the other hand, Tushare is a financial data platform mainly focused on China mainland. It’s first released open source in Dec 2014. And now the new version Tushare Pro has been released. Although it’s mainly focused on Python users, an R package tushare is also available at CRAN.
library(Tushare)
## Loading required package: httr
## Loading required package: tidyverse
## ── Attaching packages ─────────────────────────────────────── tidyverse 1.3.0 ──
## ✓ ggplot2 3.3.3     ✓ purrr   0.3.4
## ✓ tibble  3.0.6     ✓ dplyr   1.0.4
## ✓ tidyr   1.1.2     ✓ stringr 1.4.0
## ✓ readr   1.4.0     ✓ forcats 0.5.1
## ── Conflicts ────────────────────────────────────────── tidyverse_conflicts() ──
## x dplyr::filter() masks stats::filter()
## x dplyr::first()  masks xts::first()
## x dplyr::lag()    masks stats::lag()
## x dplyr::last()   masks xts::last()
## Loading required package: forecast
## Loading required package: data.table
##
## Attaching package: 'data.table'
## The following objects are masked from 'package:dplyr':
##
##     between, first, last
## The following object is masked from 'package:purrr':
##
##     transpose
## The following objects are masked from 'package:xts':
##
##     first, last
A key difference between tushare and quantmod is that in order to acquire Tushare Pro’s personal API token, one has to register an free account. After that, we can initialize tushare API in R with
api <- Tushare::pro_api(token = "PUT YOUR TOKEN HERE")
Then we can query for 300ETF data in such a way
res <- api(api_name = 'fund_daily', ts_code = "510300.SH", start_date = "20200101")
str(res)
## 'data.frame':    271 obs. of  11 variables:
##  $ ts_code   : chr  "510300.SH" "510300.SH" "510300.SH" "510300.SH" ...
##  $ trade_date: chr  "20210210" "20210209" "20210208" "20210205" ...
##  $ pre_close : num  5.69 5.55 5.48 5.47 5.49 ...
##  $ open      : num  5.71 5.58 5.52 5.49 5.46 ...
##  $ high      : num  5.83 5.69 5.57 5.55 5.51 ...
##  $ low       : num  5.7 5.55 5.48 5.48 5.42 ...
##  $ close     : num  5.81 5.69 5.55 5.48 5.47 ...
##  $ change    : num  0.115 0.138 0.072 0.008 -0.011 -0.006 0.08 0.063 -0.037 -0.136 ...
##  $ pct_chg   : num  2.02 2.485 1.313 0.146 -0.201 ...
##  $ vol       : num  3419099 4182998 4750134 5600005 3000842 ...
##  $ amount    : num  1973984 2349538 2628084 3085297 1639395 ...
head(res)
##     ts_code trade_date pre_close  open  high   low close change pct_chg     vol
## 1 510300.SH   20210210     5.692 5.706 5.833 5.697 5.807  0.115  2.0204 3419099
## 2 510300.SH   20210209     5.554 5.575 5.694 5.550 5.692  0.138  2.4847 4182998
## 3 510300.SH   20210208     5.482 5.520 5.573 5.482 5.554  0.072  1.3134 4750134
## 4 510300.SH   20210205     5.474 5.486 5.547 5.476 5.482  0.008  0.1461 5600005
## 5 510300.SH   20210204     5.485 5.460 5.510 5.416 5.474 -0.011 -0.2005 3000842
## 6 510300.SH   20210203     5.491 5.491 5.525 5.464 5.485 -0.006 -0.1093 2819695
##    amount
## 1 1973984
## 2 2349538
## 3 2628084
## 4 3085297
## 5 1639395
## 6 1549207
skimr::skim(res)
Table 1: Data summary
| Name |
res |
| Number of rows |
271 |
| Number of columns |
11 |
| _______________________ |
|
| Column type frequency: |
|
| character |
2 |
| numeric |
9 |
| ________________________ |
|
| Group variables |
None |
Variable type: character
| ts_code |
0 |
1 |
9 |
9 |
0 |
1 |
0 |
| trade_date |
0 |
1 |
8 |
8 |
0 |
271 |
0 |
Variable type: numeric
| pre_close |
0 |
1 |
4.52 |
0.57 |
3.53 |
3.98 |
4.69 |
4.92 |
5.69 |
▇▇▇▇▃ |
| open |
0 |
1 |
4.52 |
0.57 |
3.54 |
3.98 |
4.70 |
4.94 |
5.71 |
▇▆▇▇▃ |
| high |
0 |
1 |
4.56 |
0.58 |
3.58 |
4.01 |
4.74 |
4.96 |
5.83 |
▇▅▇▅▃ |
| low |
0 |
1 |
4.48 |
0.56 |
3.49 |
3.95 |
4.64 |
4.89 |
5.70 |
▇▆▇▆▃ |
| close |
0 |
1 |
4.53 |
0.57 |
3.53 |
3.98 |
4.70 |
4.93 |
5.81 |
▇▅▇▅▂ |
| change |
0 |
1 |
0.01 |
0.07 |
-0.34 |
-0.03 |
0.00 |
0.04 |
0.33 |
▁▁▇▂▁ |
| pct_chg |
0 |
1 |
0.14 |
1.47 |
-8.43 |
-0.61 |
0.12 |
0.89 |
7.34 |
▁▁▇▂▁ |
| vol |
0 |
1 |
4467546.98 |
1946338.27 |
1628381.85 |
3102811.71 |
3967685.53 |
5430194.20 |
14710757.72 |
▇▅▁▁▁ |
| amount |
0 |
1 |
2017224.92 |
880484.24 |
647069.16 |
1384610.85 |
1825584.80 |
2418173.43 |
6024138.89 |
▇▇▂▁▁ |
Details about these API keys can be found at here and here.
NOTE: A free tushare account can only access partial of the tushare database. In order to have higher data accessing privilege, one should try to increase their accounts’ points. New free account gets 100 points, with some additional 20s via finishing user profile pages. Possible ways including contribution to the community such as bug report, feature request and development. Also making donation is another acceptable approach. Details about acquiring points can be found at here. Point requirements for accessing different types of data can be found at here.