Draw OC curves of different rules
OC_Curve_Diff_Rules.RdDraw OC curves of different rules
Arguments
- rules
a data.frame with
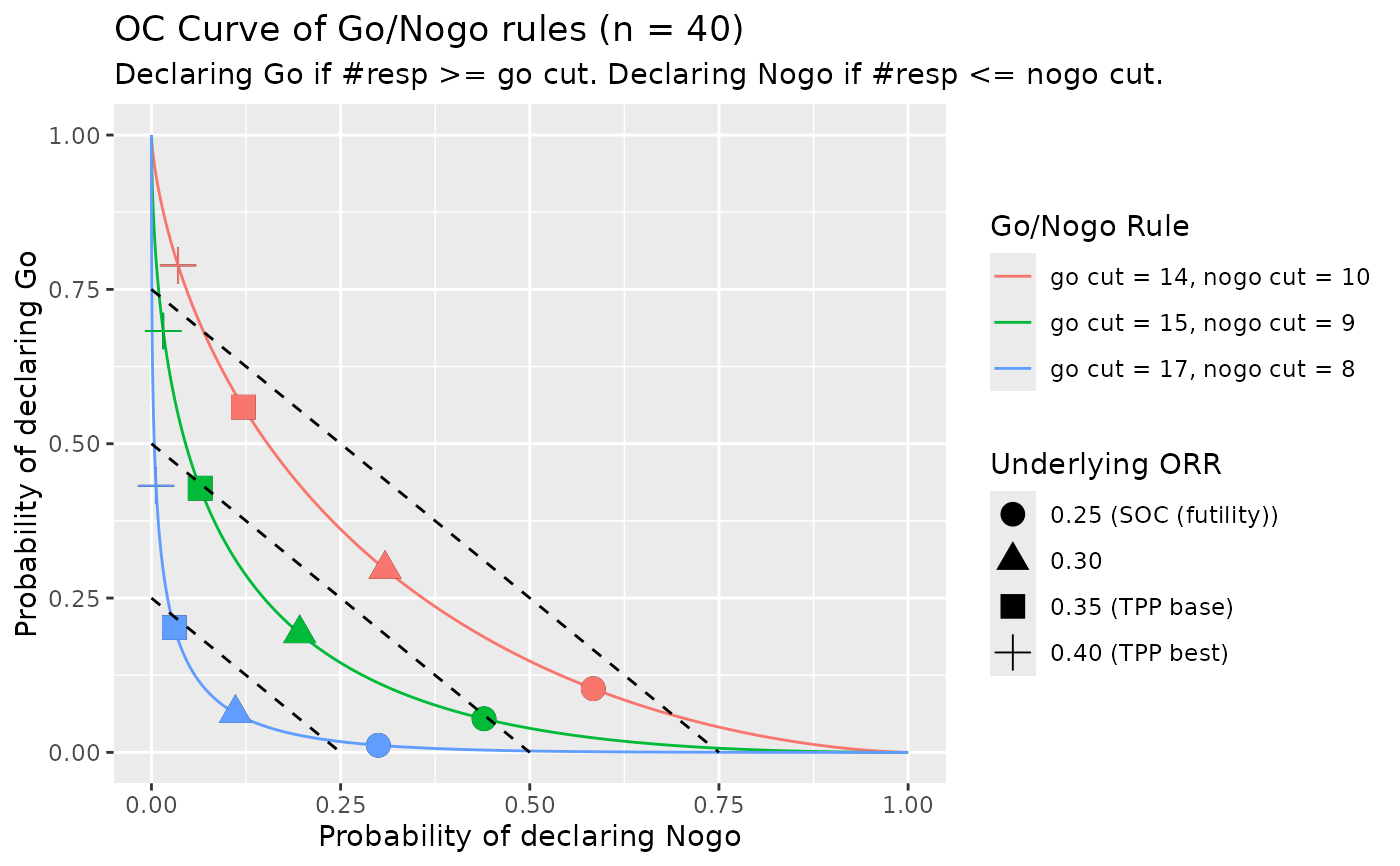
gocut,nogocut,nin this ORDER to specify the settings of Operating Characteristics(OC).gocut: Declare Go if #resp >= gocutnogocut: Declare Nogo if #rest <= nogocutn: sample size when making the go/nogo decision- theta_pick
vector of underlying ORR that you want to show in the figure
- tpp_tb
tibble(data.frame) storing TPP values of theta, it must have
tpp_tb$thetaandtpp_tb$tpp.tpp_tb$thetawill be used to match againsttheta_pick- plot_params
list of plotting parameters, currently, it supports
contour_vec: a vector storing the contour lines
Examples
# sample size n = 40
# compare several rules:
#    1. gocut = 15, nogocut = 9;
#    2. gocut = 17, nogocut = 8;
#    3. gocut = 14, nogocut = 10.
rules <- data.frame(
    gocut = c(15, 17, 14),
    nogocut = c(9, 8, 10),
    n = 40
)
# interested in underlying ORR c(0.25, 0.3, 0.35, 0.4)
theta_pick <- c(0.25, 0.3, 0.35, 0.4)
# among them, we provide TPP/SOC label
tpp_tb <- data.frame(
    theta = c(0.25, 0.35, 0.40),
    tpp = c("SOC (futility)", "TPP base", "TPP best"))
# Draw the OC figure
oc_fig <- OC_Curve_Diff_Rules(rules, theta_pick,tpp_tb,
                              plot_params = list(contour_vec = c(0.25, 0.5, 0.75)))
oc_fig